Intelligent project management with
Platform that empowers investors to select and monitor construction projects with clear metrics, automated reporting, and real-time data visualization.
Metrics that drive decisions
Comprehensive platform for every project phase
Project Management
Centralized control of tasks, resources, and schedules with automatic alerts for deviations. Detailed tracking of physical and financial progress to keep the project on track.
Investor Dashboards
Custom visualizations that allow comparing projects based on specific investment criteria: expected profitability, risk level, and time horizon.
Automated Reporting
Scheduled generation of detailed project status reports, financial projections, and deviation analysis, sent directly to stakeholders.
Cost and Progress Control
Real-time monitoring of expenses versus budget, with earned value analysis (EVM) to identify trends and take early corrective actions.
Integrations
Connection with existing ERP, accounting systems, and planning tools to centralize all information without duplicating data entry efforts.
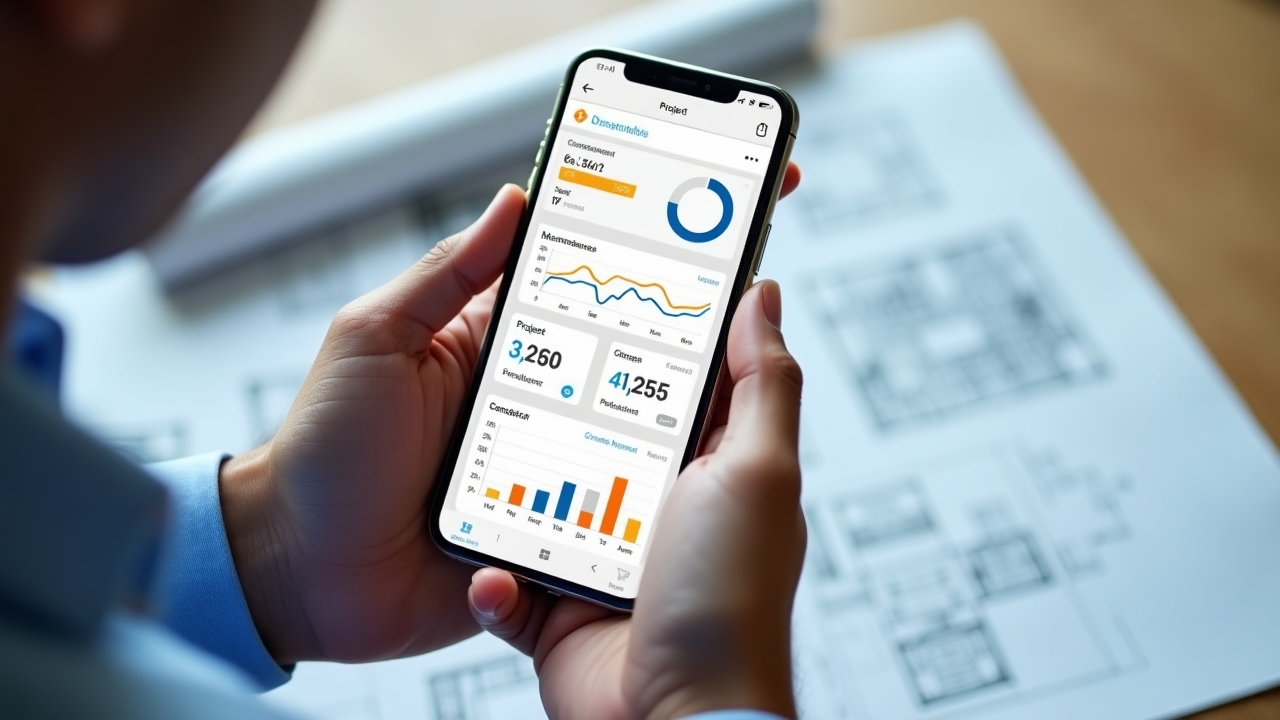
Mobile Access
Mobile-optimized app that allows monitoring projects, approving changes, and reviewing key metrics from anywhere at any time.
Dashboards that transform data into decisions
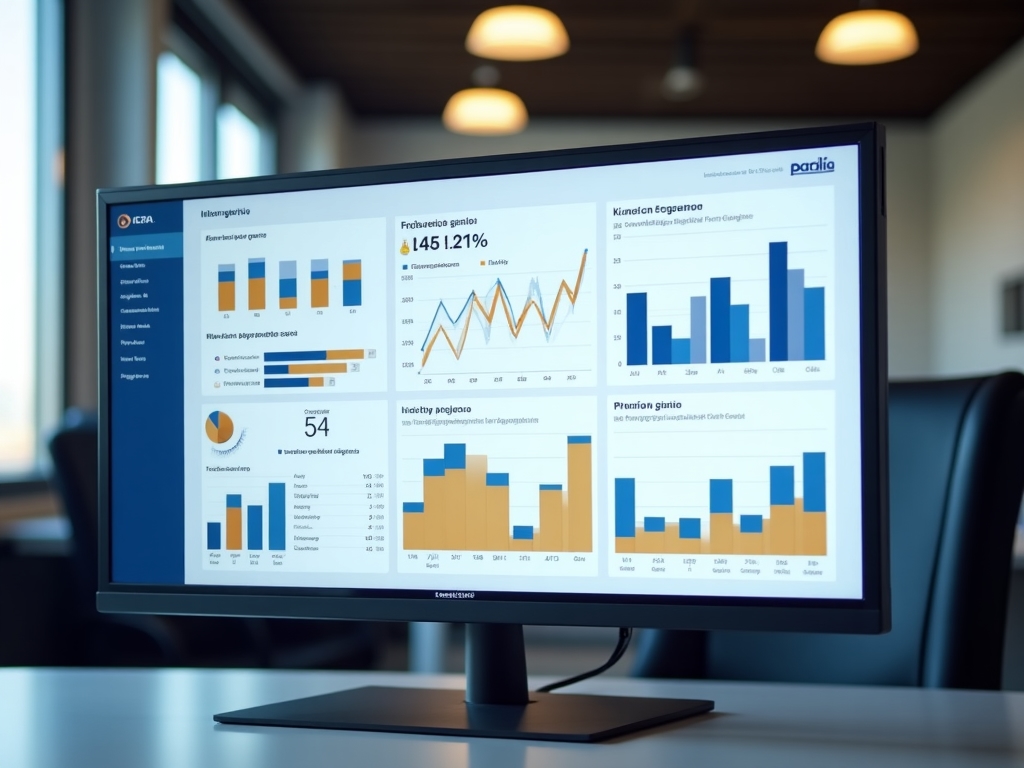
Global performance dashboard showing key progress, cost, and projection metrics for a comprehensive project view
Automated reporting that saves time
The power of timely information
Investors and project managers face a common challenge: getting up-to-date, actionable information without spending hours collecting and analyzing data. Our automated reports transform this process.
Each report is generated based on the frequency you choose (daily, weekly, monthly) and automatically distributed to stakeholders. Formats include:
- Detailed PDF reports with analysis and recommendations
- CSV exports for additional analysis
- Interactive dashboards for data exploration
Investor Scenarios
Reports allow investors to evaluate projects based on different criteria:
18%
Investors can choose between conservative profiles with lower risk and moderate return, or aggressive profiles with higher profit potential but greater exposure.
The system automatically personalizes the showing KPIs according to the investor's profile, highlighting the most relevant ones for their strategy.